Creating a visualization of a C++ project with doxygen
Doxygen can create beautiful figures out of your C++ source code. Even if it not really useful, you can at least look at a nice graph that shows all the complicated dependencies of the objects in your project.
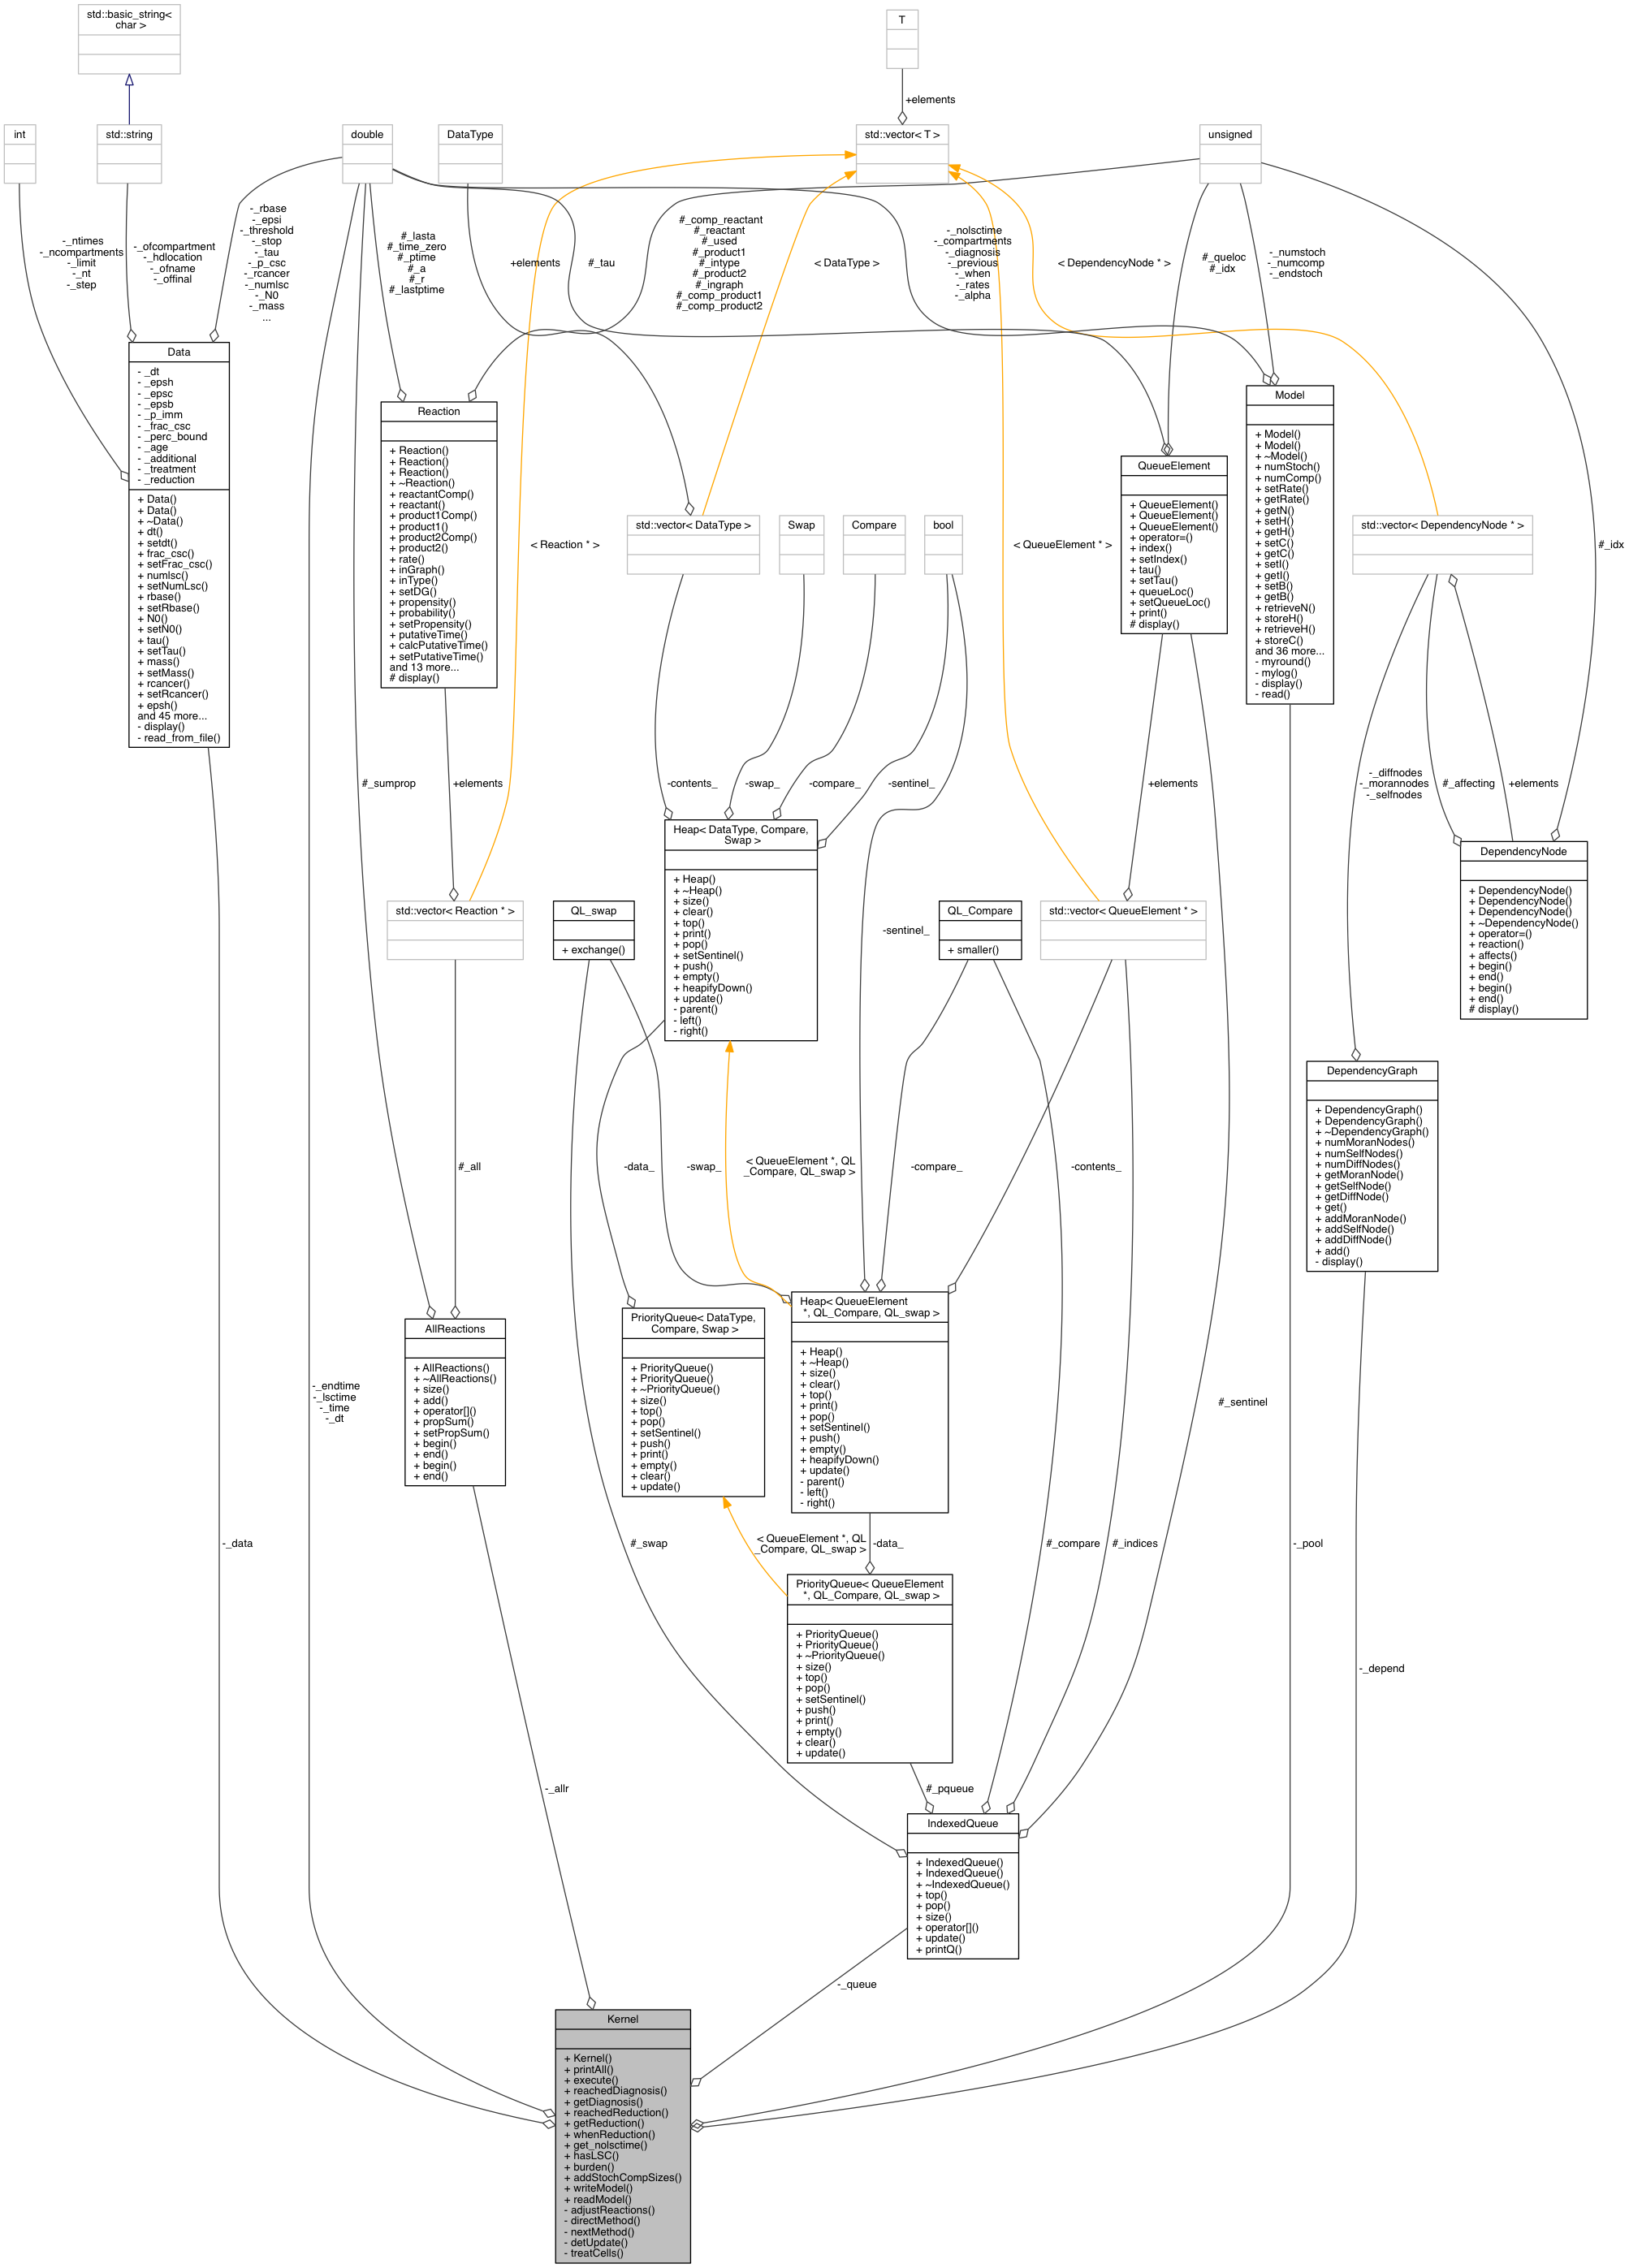
The above image was produced for Stochtreat. Below are the instructions to create this graph using the terminal in Mac OS:
- To install doxygen you can use
brew install doxygen(of cause only if you have homebrew installed). - For creating the graphs you also need graphviz:
brew install graphviz. - You then need to create a config file inside your projects folder:
doxygen -ggenerates a commented default config file with the name “Doxyfile”. - In the now generated file “Doxyfile”, set some or all of the following variables (in principle just search for “dots” and change the related settings):
    PROJECT_NAME           = "something"
    OUTPUT_DIRECTORY       = ./doxydoc/
    BUILTIN_STL_SUPPORT    = YES
    EXTRACT_ALL            = YES
    INPUT                  = ./src ./include
    RECURSIVE              = YES
    HIDE_UNDOC_RELATIONS   = NO
    HAVE_DOT               = YES
    UML_LOOK               = YES
    CALL_GRAPH             = YES
    CALLER_GRAPH           = YES
- Finally, start
doxygen Doxyfileand you will find your beautiful figures in the documentation inside the ./doxydoc/ folder.