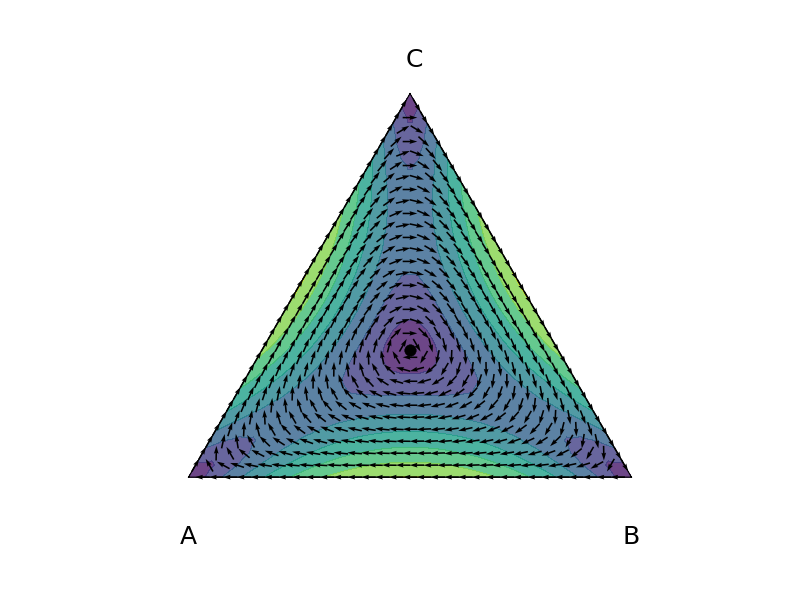
Simplex plot with python and matplotlib

A simplex is a nice way to visualize the dynamics of a three dimensional evolutionary game. The closer to a certain corner a point is, the higher the frequency of the corresponding type in the population - right on the corner the population consists of only one type. Arrows point in the direction of change of the population composition for the chosen dynamics and the color denotes how fast this change will be.
Create a simplex plot
To create a simplex plot there are several tools available in the web, for example the Mathematica notebook Dynamo. Mathematica, however, is quite expensive. Therefore I wrote a small python library egtsimplex which is very simple but should be easy to extend. Fell free to contribute :-)
To create the very same plot as you see above you need:
- A relatively recent python3 and matplotlib. On Mac OS you can install both with homebrew.
- The repository egtsimplex cloned to your computer:
git clone http://github.com/marvinboe/egtsimplex.git
Then you can start plot_example.py with:
python3 plot_example.py
The example file should be relatively self-explanatory.
For example in the definition of the function for the dynamics you can choose a different payoff matrix A=np.array([[a,b,c],[d,e,f],[g,h,i]]).
Have fun playing around with it!